Blog · · 4 min read
Fast, and fast under load, are different claims
A Lighthouse score is one user on an empty site. The number that matters is what checkout does in your busiest hour, and most teams never measure it.
Most teams measure performance once. One user, no load, a quiet afternoon, lab conditions. The number goes on a slide and the site is called fast.
I worked on Magento builds for years, and this is the illusion I saw every peak season. Here is what I wish more teams knew before the campaign email goes out.
A Fast Site in the Lab
A Lighthouse score is one browser, one session, nobody else on the site. Useful as a baseline. Misleading as a ceiling. Teams put 95 on a dashboard and call the site fast, when all they have shown is that it is fast while it is empty. Your sale is not one user. The hour that decides the quarter is hundreds or thousands of concurrent sessions, and most teams have never measured performance at that number.
Full page cache deepens the illusion. The catalogue flies, demos look great, Lighthouse is happy. Then a real customer does something the cache cannot serve. Add to cart. Log in. Apply a voucher. Start checkout. Every one of those hits PHP, the database and a stack of third-party calls. Under load, the cached site and the uncached site behave like two different applications. You have been testing the fast one. Your customer meets the slow one, at the worst possible moment.
Protocol load tests carry the same blind spot from the other side. They fire HTTP requests at the server and time the responses, which proves the server can return HTML quickly. They never render the page. No JavaScript runs. No tag manager, no chat widget, no payment iframe. So the test passes at thousands of requests per second, everyone signs off, and on launch day customers sit looking at a half-loaded page. The server was fine. The page was not.
Green Dashboards, Gone Carts
A site can report 100% uptime through the sale while checkout takes 14 seconds to load. Both are true at the same time. Uptime monitoring checks a single thing, whether the server answered. A server can answer in 200 ms while the page takes 12 seconds to become usable on a real device. The revenue leaks in the gap between up and working.
Every peak-season post-mortem I have seen contains a version of the same line. All dashboards were green. CPU fine, memory fine, error rate fine, and conversion still dropped for three hours. Infrastructure metrics describe machines, not customers. Nothing in CloudWatch says product images took 11 seconds to paint, or that checkout went unresponsive on mobile. The dashboards were green because nobody was measuring the thing that broke. The browser.
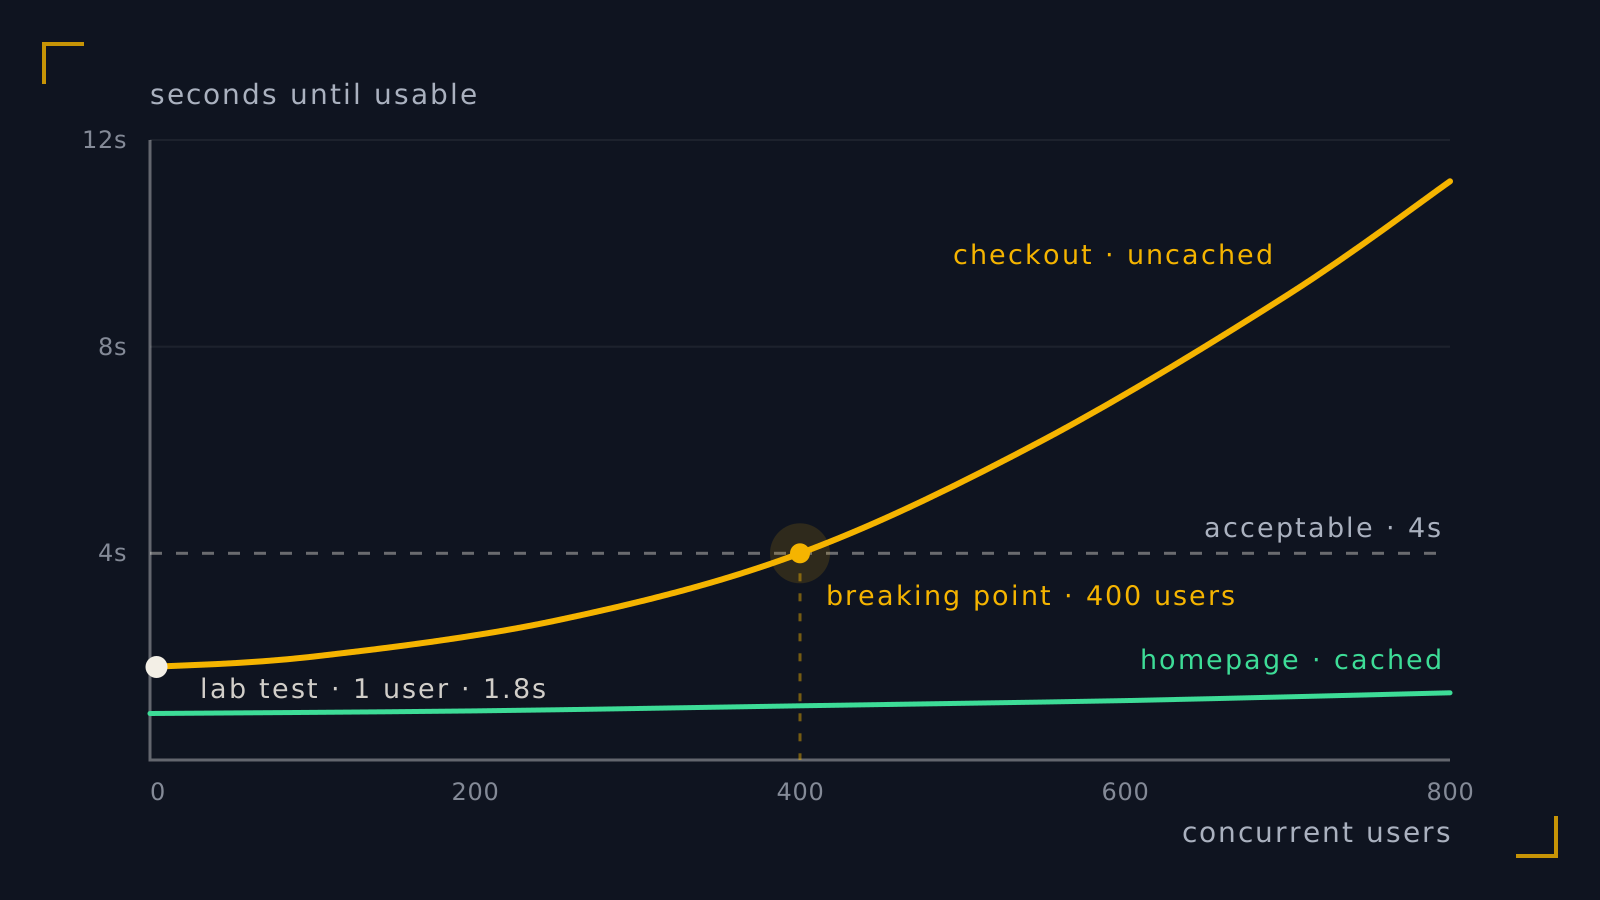
And sites do not fail at a single moment. They degrade on a curve. At 100 users checkout loads in 2 seconds. At 400 it takes 4. At 700 it takes 9, and people abandon long before anything throws an error. Somewhere on that curve the experience stops being acceptable, and every site has that point. Most teams find theirs in production, during the campaign, where it costs the most. The breaking point exists whether you have measured it or not. You only choose when you learn about it.
Real user monitoring will tell you exactly what customers experienced, in the past tense. By the time it shows checkout latency climbing during your biggest campaign, the carts are already gone. Monitoring answers what happened. It cannot answer what happens when Black Friday traffic hits this release. One watches production. The other rehearses it before it ships. Most teams have the first and not the second.
You Scheduled the Spike
The email goes to 200,000 people at 7 pm. Marketing planned it for six weeks. Segments, creative, send time, all optimised. Nobody asked engineering what happens when 3,000 of them hit the same product page in two minutes. This is the strange part of how e-commerce works. We spend real money manufacturing a traffic spike, then treat the load as a surprise. The spike is not the weather. It is on a calendar, and it can be rehearsed at full traffic before a single customer sees it.
So this is what I ask teams to do instead. Measure LCP in your busiest hour, not on a quiet afternoon, because a page that loads in 1.8 seconds with one user can take 9 with 800 on the same code. Test the paths the cache cannot serve. Cart, login, voucher, checkout, payment. Cached pages prove the CDN, and uncached pages take the money. Run the load test in real browsers, so the JavaScript, the tags and the payment iframe are part of what is measured. Find your curve before the campaign does, so you know where checkout stops being acceptable and what breaks first. And put the rehearsal on the same calendar as the campaign. If the send date is fixed, the test date should be too.
Fast, and fast under load, are different claims. Only one of them pays the bills.